This figure is a candidate for the ORNL booth tower with the rotating light box.
Available as:
- PostScript (preferred, best quality)
- Jpeg
Forrest M. Hoffman, William W. Hargrove, John B. Drake, and W. Mac Post
|
This figure is a candidate for the ORNL booth tower with the rotating light box. Available as:
|
 |
This figure is a candidate for the ORNL booth tower with the rotating light box. Available as:
|
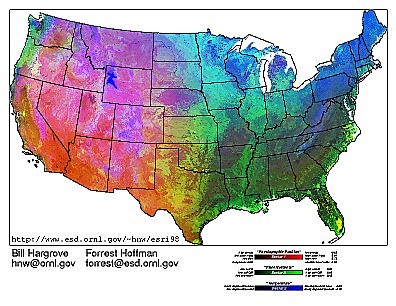
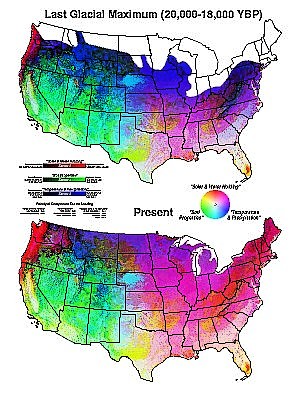
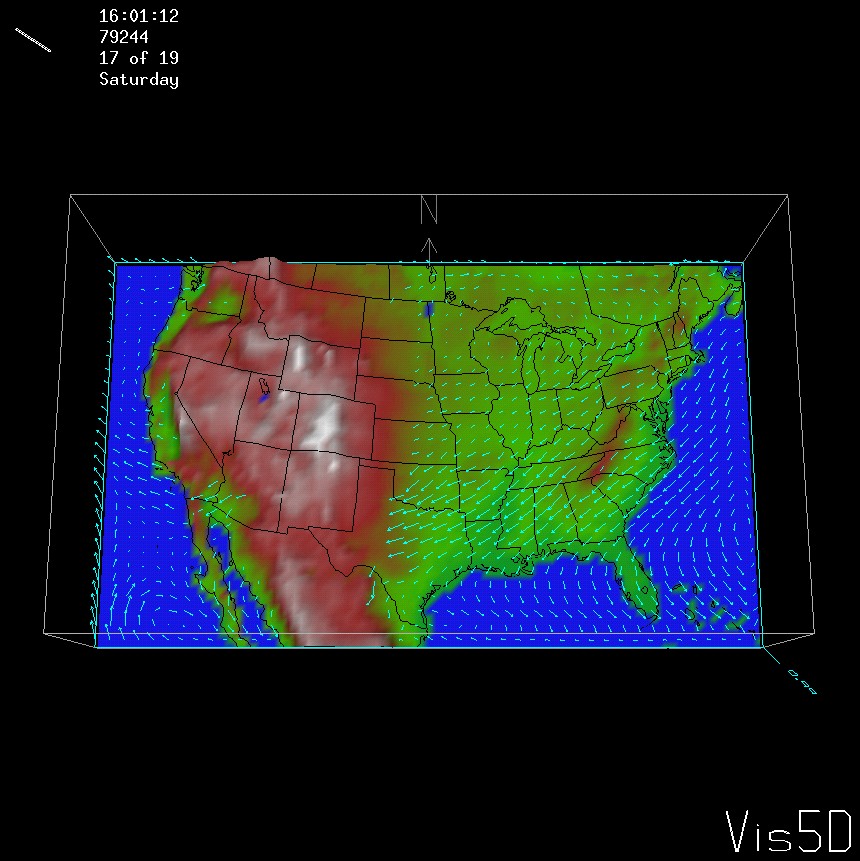
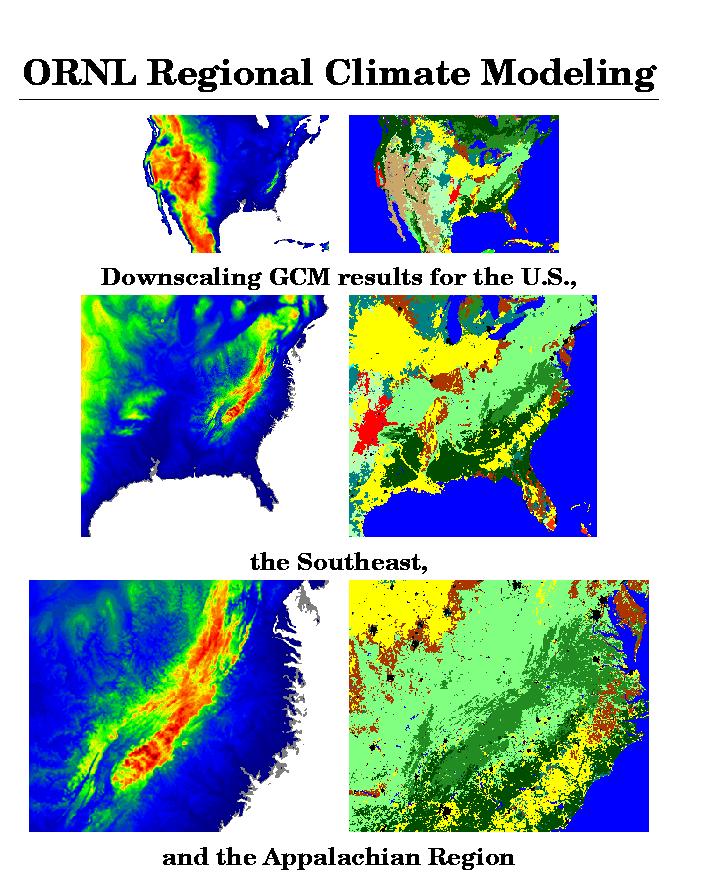
Large and long time series databases are useful in many studies including the National Multivariate Geographic Clustering project at ORNL. For this project, the continental United States was clustered on 9 geophysical variables, including soil (edaphic), climate, and elevation factors, derived from such databases. Non-hierarchical clustering of these variables at a resolution of 1 square km (resulting in 7.8 million map cells) was performed in an effort to determine regions in which trees thrive or just survive, and to understand factors which limit the productivity of forests. A principal components analysis was performed to effectively allow all nine variables to be shown on a single map. Redder areas are dominated by low precipitation, high solar input, and high elevation; greener areas are dominated by high soil nutrients; and bluer areas are dominated by cooler temperatures. |
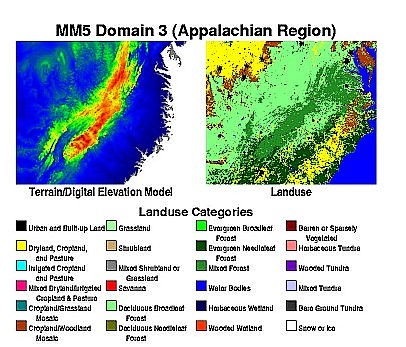
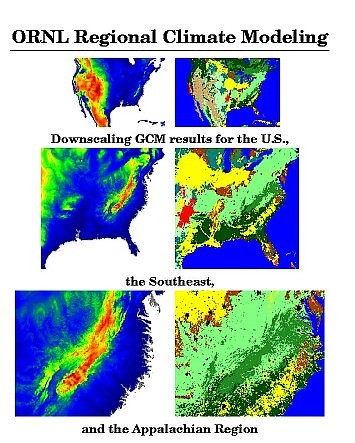
In order to reach even finer spatial and temporal scales, a process-based modeling approach is used. The NCAR/PSU MM5 Mesoscale Meteorology model was modified to utilize CCM output as boundary conditions for the region(s) of interest. The continental U.S., the southeastern U.S., and the Appalachian region are modeled in a nested grid configuration at resolutions of 27 km, 9 km, and 3 km respectively. 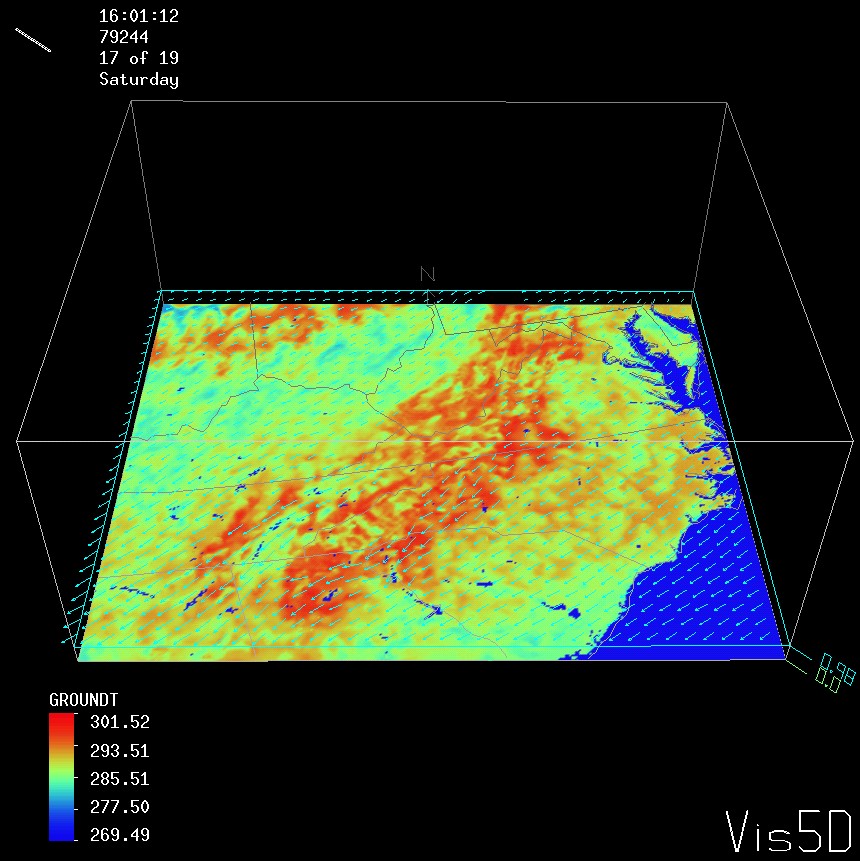
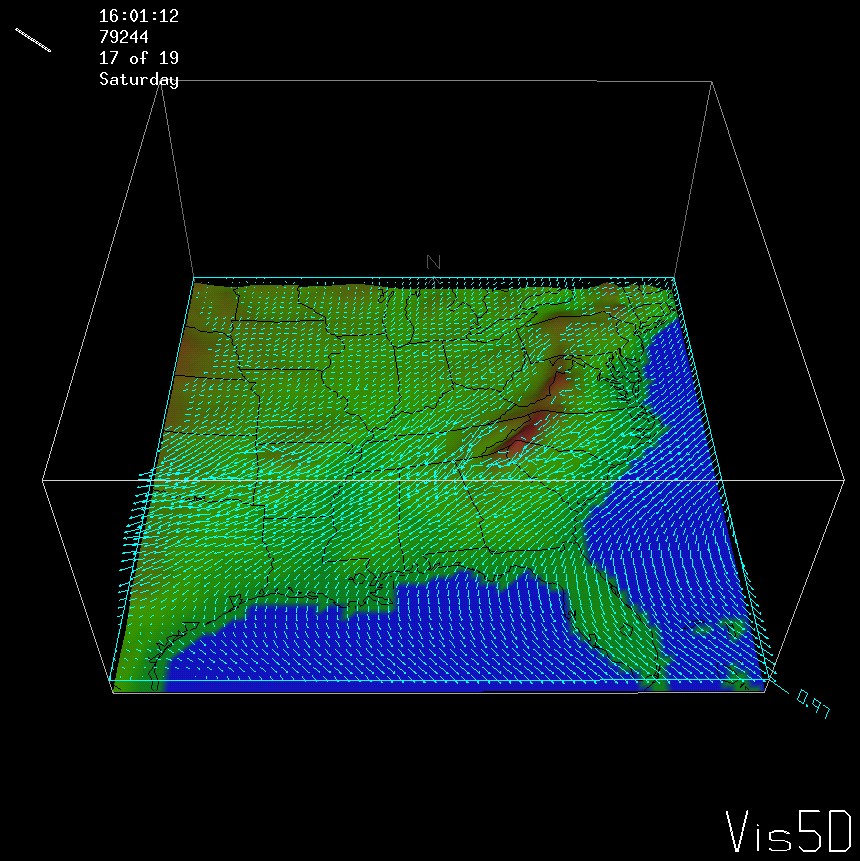
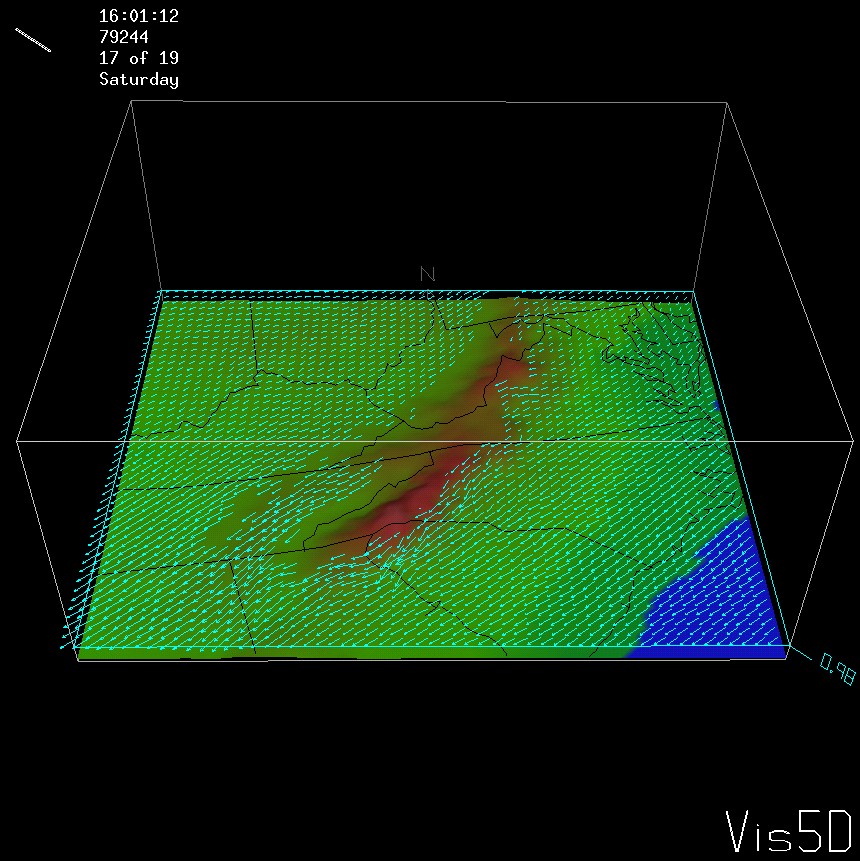
At this scale, effects of orography and vegetation can be observed and they are modeled explicitly. Moreover, projections can be made for individual weather events or climate conditions on relatively short time scales. In the figure at left, ground temperature and wind vectors for domain 3 of the simulation are shown for Sept. 1, 1979, at 16:01:12 GMT. The variation in wind speed and direction around the Appalachian mountains, on a scale unresolvable by traditional GCMs, is computed by the MM5 model which uses CCM results as boundary conditions. |
 |
 |
|
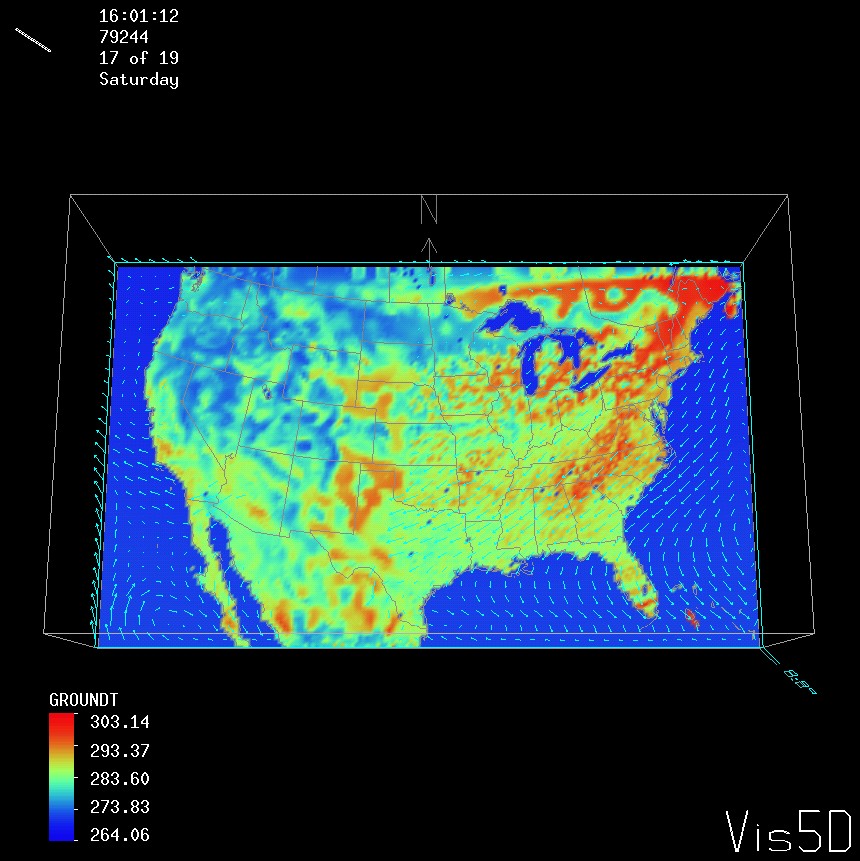
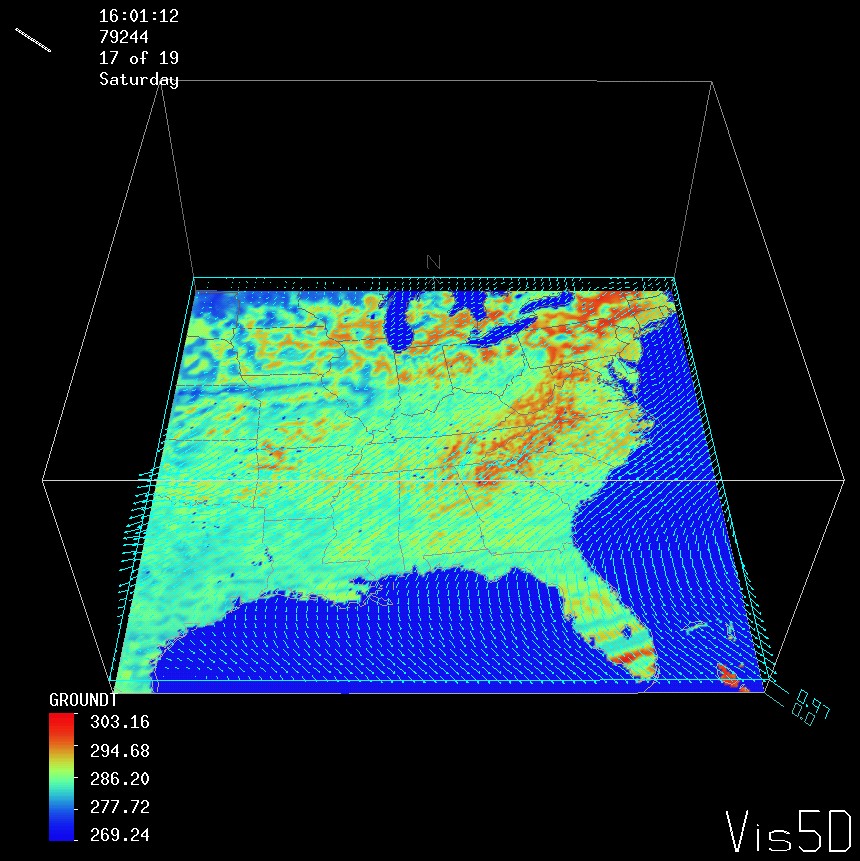
| Ground temperature and wind vectors from MM5 mesoscale model for domain 1 at 16:01:12 GMT on Sept. 1, 1979 | Ground temperature and wind vectors from MM5 mesoscale model for domain 2 at 16:01:12 GMT on Sept. 1, 1979 | Ground temperature and wind vectors from MM5 mesoscale model for domain 3 at 16:01:12 GMT on Sept. 1, 1979 |
 |
 |
 |
| Wind vectors from MM5 mesoscale model for domain 1 at 16:01:12 GMT on Sept. 1, 1979 | Wind vectors from MM5 mesoscale model for domain 2 at 16:01:12 GMT on Sept. 1, 1979 | Wind vectors from MM5 mesoscale model for domain 3 at 16:01:12 GMT on Sept. 1, 1979 |