4th International Conference on Integrating GIS and Environmental Modeling
(GIS/EM4):
Problems, Prospects and Research Needs. Banff, Alberta, Canada, September
2 - 8, 2000.
An Analytical Assessment Tool for Predicting Changes in a Species Distribution Map
Following Changes in Environmental Conditions
GIS/EM4 No. 104
William W. Hargrove
Forrest M. Hoffman
Abstract
We have developed a GIS-based statistical technique which empirically
predicts changes in the spatial distribution of habitat for a plant or animal
species over a geographic area that has
undergone a scenario of change in specified environmental
conditions. The technique is illustrated with Pinus taeda L.,
loblolly pine, and Acer saccharum Marsh., sugar maple, under two
future climate change scenarios for the continental U.S.
We use a new Multivariate Spatio-Temporal Clustering
(MSTC) approach that we developed for
application on raster data within a GIS. MSTC employs non-hierarchical
clustering on the individual pixels in a digital map from a GIS for the
purpose of classifying the cells into
types or categories. Our technique uses the standardized values of
each environmental condition (e.g., temperature, rainfall, soil) for
every raster cell in the map
as a set of coordinates that together specify a position for that
raster cell
in a data space having a dimension for each of the
included environmental characteristics. Two raster cells from anywhere
in the map that have similar combinations of environmental
characteristics
will be located near each other in this data space. Their proximity and
relative positions in data space will quantitatively reflect their
environmental
similarities, allowing these cells to be classified into
environmentally similar groups. MSTC combines aspects of traditional
GIS and statistical
clustering techniques.
Using the classification abilities of MSTC, we compared and
grouped map cells by selected environmental conditions found within the present continental U.S. with
conditions predicted to occur here according to two
alternative future climate scenarios. Environments were specified in
terms of 25 condition characteristics. We obtained high-resolution
simulation forecasts for conditions within the continental U.S. in the
year 2099 according to two global climate simulation models that are
recognized by the U.S. National Assessment: the Canadian Climate
Centre model, and the Hadley UKMO model. The VEMAP program has made
yearly data sets for these models available for the period between 1994
and 2099 at 0.5 degree resolution for the continental United States.
From these models, we obtained the simulated forecasts for monthly minimum and maximum
temperature, monthly solar irradiance, and monthly precipitation. We
calculated differences between present and future conditions predicted
in the year 2099 by each of the two models. Difference layers were
applied to our high resolution maps of current conditions within the
United States in order to obtain predicted conditions. Thus, sixteen of the
25 environmental conditions were altered to represent the conditions
forecast to occur within the continental U.S. in the year 2099 by each
model.
A variant of the MSTC procedure can be used to generate a model of the environmental envelope or
niche of a particular species.
We use the current distribution of Pinus and Acer to define their respective niches, then
alter the map, and use the niche definition to classify map pixels and delineate the new distribution
of habitat suitable for these tree species within the map.
This technique is significant for assessing predicted effects of
changes in environmental conditions (i.e., global warming) on the
potential distribution of suitable habitat for both plants and animals.
Making a special prediction of the current geographic range of a species allows us to test the
robustness and adequacy of the niche model. Conditions present within the current U.S. are used
to
predict a current geographic range for the species, which can be compared with the known actual
geographic distribution. When the
fitness prediction obtained for each species when the
current conditions within the United States are tested against the
hypervolume definitions, the predicted distributions strongly resemble
the known current distributions for both of these tree species.
The niche model-based geographic predictions
are somewhat more extensive in terms of the outer, low-fitness
peripheral areas, but still strongly resemble the original geographic
ranges which were used as input to the model development process.
Predictions for a simple uniform climate warming scenario are surprising. Habitat distributions for
the tested tree species generally dissapate and evaporate, without visible northward migration. We speculate that environmental
conditions in many cells of the new maps may represent new combinations never seen in the present
U.S. The performance of species cannot be predicted inside such cells, since the cells have left the
inference space of the training data set. Methods for identifying such unpredictable cells,
and speculation about their abundance and distribution are discussed.
Keywords
Acer, Bailey, CCC, climate, clustering, ecoregion, geographic
distribution, habitat, Hadley UKMO, Hutchinson, hypervolume, MSTC,
niche, Omernik, Pinus, range, regionalization, tree, warming
Introduction
Locating borders between ecoregions is truly a multivariate decision
process that must make reference to a number of large geographic data
sets, one for each environmental condition which is to be considered (Hargrove and Hoffman 1999).
We have developed an objective technique combining multivariate
statistics and a Geographic Information System (GIS) which objectively
computes the placement of borders between ecoregions, given maps of all
environmental conditions that one wishes to consider. Rather than
relying on expertise, our technique uses the standardized values of each
environmental condition for each individual raster cell in the map as
a set of coordinates that specify a position for that raster cell in
a data space having as many dimensions as the number of
included environmental characteristics. Two raster cells from anywhere in
the map having similar combinations of environmental characteristics will
be located near each other in data space, and their nearness and relative
positions will quantitatively reflect their environmental similarities.
Methods
The steps of the process are shown in Figure 1.
After their disassembly from geographic space, the map cells are
re-plotted in environmental data space like stars in a data universe.
Because the density of these cells in data space is not uniform, we use
an iterative classification procedure to group various nearby ``stars''
into clusters having similar combinations of environmental conditions.
This procedure begins with the specification by the user of the desired
number of ``galaxies'' or clusters into which the stars are to be grouped.
All observations are examined sequentially to find the most widely
separated set of stars which will provide this number of initial cluster
``seeds.'' Thus, the number of ecoregions which result from the process
is under the user's control.
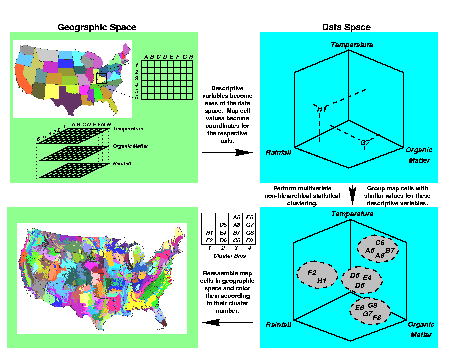
|
Figure 1. The Multivariate Spatio-Temporal Clustering procedure. The left half of the flowchart is
in geographic or map space, and the right half is in abstract data space. If performed on multiple
maps representing a chronosequence, the same clustered combinations are identified whenever and
wherever they occur.
|
Each map cell is then compared against all cluster seeds, and the map
cell is assigned membership to the cluster whose seed is closest to it
in terms of Euclidean distance. After all map cells have been assigned,
new cluster centroids are calculated to be the mean of each coordinate
over all cells assigned membership to that cluster (Hartigan and Wong 1979). Then the iterative
assignment procedure repeats. Stars do not move in environmental data
space; rather, the centroids of the cluster ``galaxies'' slowly slew until
an equilibrium classification is obtained. When fewer than a specified
number of map cells change cluster assignment in a particular iteration,
the process converges and halts.
Map cells with their final cluster assignments can then be re-assembled
into their proper geographic positions, and the resultant ecoregion map
can be color-coded by the cluster assignment. Because raster cells
adjacent in the map are likely to have similar environmental values,
ecoregion clusters are often geographically contiguous. However,
because the geographic location is not used for clustering, clusters
can be spatially disjoint, and two map cells with similar environments
could be classified in the same ecoregion even though they are widely
separated geographically. Two widely-spaced mountain tops, for example,
could be classified in the same ecoregion cluster if their environments
are similar enough. We have used the MSTC procedure to create objective ecoregions for many different areas.
We call this empirical process Multivariate Spatio-Temporal Clustering (MSTC),
and have implemented it in a parallel algorithm coded in C using the
Message Passing Interface (MPI). Our code is dynamically load-balancing,
fault-tolerant, and performs both initial seed-finding and iterative
cluster assignment in parallel (Hoffman
and Hargrove 1999b). The clustering algorithm is inherently
parallelizable, since individual nodes can independently classify
subsets of cells, then combine results at the end of the iteration.
We developed the Multivariate Geographic Clustering parallel algorithm
and code on a heterogeneous Beowulf-class parallel machine
constructed from surplus 486- and Pentium-based personal computers (Hoffman and Hargrove 1998,
Hoffman and Hargrove 1999a, Hoffman and Hargrove 1999c.
We have also performed MSTC across multiple supercomputers interconnected via GLOBUS (Mahinthakumar et al. 1999).
Clustering through time
MSTC can also be used to consider not just a single map, but a
chronological sequence of two or more maps coded with multiple
environmental attributes changing through time. Individual maps at
each single point in time are comprised of cells with which are
associated a particular set of environmental characteristics relevant
to human health concerns. All cells from all maps in the
chronosequence, each with their specified ``mix'' of attributes, are
submitted to a single MSTC analysis.
MSTC objectively and empirically organizes the cells into groups which
have similar combinations of environmental characteristics, regardless
of where in space or time the cell originally began. The number of
groups is specified beforehand by the user. Although not used directly
by MSTC, the spatial and temporal location of each cell is stored, so
that the grouped cells can be re-assembled, now with their clustered
combination assignment, back into the original chronosequence of maps.
Thus, the MSTC process objectively identifies and creates groups of
similar cells sharing similar environmental conditions across all maps
in the sequence, i.e., across time and space.
Since all spatial cells in the chronosequence are submitted to a single
MSTC analysis, the particular unique combination of conditions
represented by each group is retained across all maps in the time
series. After map re-assembly, a particular clustered combination of
environmental conditions may be present in all, a few, or only one map
in the chronosequence. Because cells with similar combinations of
environmental characteristics are likely to be adjacent in geographic
space, clustered combinations often (but not always) form contiguous
regions in each map in which they are present. Across maps in the time
sequence, these regions representing a particular environmental
combination may change in size, shape, and location. Even though they
may grow or shrink in area, or even appear and dissappear
during the chronosequence, each of the clustered combinations
is a discrete and unique entity which can be tracked across space and
through time.
Data on environmental characteristics
We characterized environments in terms of the combination of 25 variables listed in Figure 2. The
factors included elevation, maximum, mean, and minimum annual temperature, monthly precipitation,
several soil parameters, number of frost-free days, and solar aspect and input. Each of these layers
represents a data map which was developed for the continental United States, at a resolution of 1
km2.
There are over 7.8 million map cells in each of the 25 layers. Each
layer was developed from different public-domain data sources or
surrogates in a unique
way, but the detailed description of the data development methods is
beyond the scope of this
manuscript. Rather, we will concentrate on the MSTC method here, which
can be used with any
combination of data from any source.
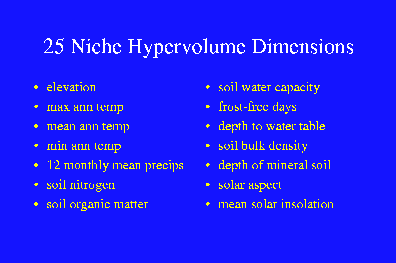
|
Figure 2. Environmental characteristics considered in the
Multivariate Spatio-Temporal Clustering procedure. Each of the 25
characteristics represents a 1 km resolution map of the continental
U.S. containing
more than 7.8 million cells.
|
Comparing the present with two alternative futures
We analyzed three maps simultaneously using MSTC in
order to regionalize a time series of maps
into a set of common environmental regions which are comparable across
the series. We compared the
present environment of the U.S. in terms of the 25 variables with two
alternative future versions of
the U.S. at a point 99 years in the future. We implemented two global
climate models by altering 16 of the 25
variables in spatially explicit ways, and then used MSTC to find 100
common environmental
combinations across this set of three maps. One prediction is from the
Hadley United Kingdom
Meterological Office (UKMO), and the other is from the Canadian Climate
Centre (CCC). Both
predictions are for the year 2099.
Thus we are intercomparing the present with two alternative versions of
the future, three maps in the set, each 25 layers deep, each layer with
7.8 million cells.
We obtained high-resolution simulation forecasts for
conditions within the United States in the year 2099 according to two
global climate simulation models which are recognized by the U.S.
National Assessment: the Canadian Climate Centre model, and the Hadley
UKMO model. The VEMAP program has made yearly data sets for these
models available for the period between 1994 and 2099 at 0.5 degree
spatial resolution for the continental United States.
We obtained the simulated forecasts for for monthly minimum and maximum
temperature, monthly solar irradiance, and monthly precipitation. We
used an IDL program to calculate differences between present and future
conditions predicted in the year 2099 by each of the two models.
Because particular years could be unusual, we averaged over a five-year
interval beginning with 1994, and over a five year interval ending with
2099, and took the difference between the means as the predicted
change. We also needed mean annual temperature
differences. These were obtained by lumping all 12 monthly minimum and
maximum temperatures for each of the five years in the starting and ending
intervals, and calculating an average difference between the
intervals.
Difference layers were applied to our high resolution maps of current
conditions within the United States in order to obtain predicted
conditions.
Sixteen of the 25 environmental conditions
were altered to represent the
conditions forecast to occur within the United States in the year 2099
by each model.
Because of the inherent spatial coarseness of the modeled
conditions (0.5 degree) relative to the high resolution of the
present-day conditions (1 km2), there were some ``slivers'' near the
coastline of the United States which extended beyond the edge of the
predictions. Areas in these small ``slivers'' remained unchanged.
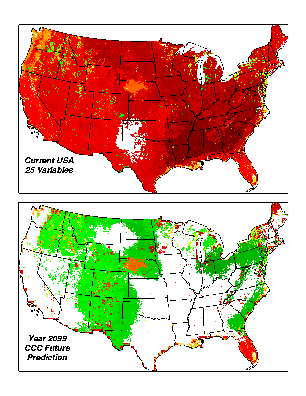
The first pair of the triad of maps, the present and
the CCC scenario for the future, are compared in Figure 3. Geographic
regions having the same clustered mix of environmental conditions are
colored
randomly, but, because the SAME random color table is used for all
maps, changes in the location and
area affected by different environmental conditions can be traced
between maps. This level of division makes visual identification of the
same area relatively easy across maps.
The northeast, for example, experiences very little change, although
conditions within the northeast
shrink somewhat in Pennsylvania. The red cluster of the coastal plain
divides into a
Mississippi valley component and an Atlantic seaboard component. A
green coastal Texas cluster
shrinks to a tiny area near Galveston Island. Many severe changes are
predicted for California by
this model, making artefacts of the coarse resolution of the prediction
visible there.
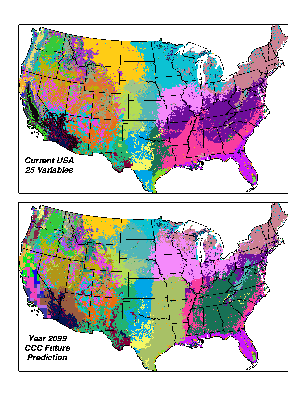
|
Figure 3. Comparison of the environment within the present-day U.S. and that predicted for the year
2099 by the Canadian Climate Centre (CCC) GCM for the VEMAP program. One hundred common
environmental combinations were identified across three versions of the U.S., the present and two
alternative future scenarios for 2099, using Multivariate Spatio-Temporal Clustering. This figure
compares the first pair only. Random colors of the regions are common across the triad of maps.
Comparison of any color across maps indicates how that environmental combination will change in size
and shift geographically according to this future climate scenario.
|
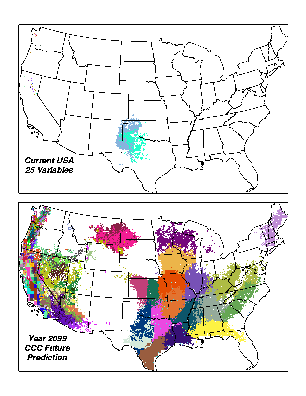
The second pair of the three maps, shown in
Figure 4, compare the environmental conditions at present
with those predicted by the Hadley UKMO model for 2099. Because the
random colors are standardized
and refer to the same combinations, regions in these maps can also be
compared with Figure 3. The red coastal plain dissolves into a
number of small remnant clusters around the periphery of a new cluster
combination according to this
forecast. The lime green coastal Texas cluster grows to become the
dominant cluster in eastern
Texas. The maps are much higher resolution than is evident in the
images shown here, and areas of
interest can be enlarged to see much additional detail.
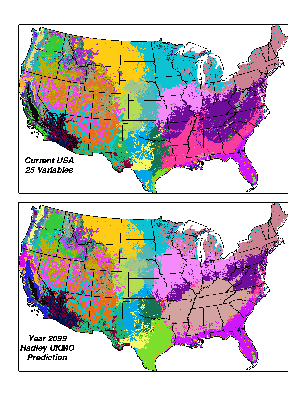
|
Figure 4. Comparison of the environment within the present-day U.S. and that predicted for the year
2099 by the Hadley United Kingdom Meterological Office (UKMO) GCM for the VEMAP program. One hundred common
environmental combinations were identified across three versions of the U.S., the present and two
alternative future scenarios for 2099, using Multivariate Spatio-Temporal Clustering. This figure
compares the second pair only. Random colors of the regions are common across the
triad of maps. Comparison of any color across maps indicates how that environmental combination will change
in size
and shift geographically according to this future climate scenario.
|
Area changes for particular environments
We can depict the area changes in particular environments, whether they grow in size, stay the same,
or shrink in area, using a map with stoplight colors. Red indicates a shrinking environment, yellow
is no change, and green is a growing environmental combination. Of course, these environments may not
remain in the same geographic locations. Nevertheless, examination of Figure 5 for area changes,
along with Figure 3 for geographic area shifts gives a complete picture of the changes forecast by
the CCC scenario.
Figure 5 makes it clear that most present-day environments will decrease in area, and will yield
to a nearly complete environmental changeover.
|
Figure 5. Changes in area for each of the clustered combinations from the present to the year 2099 as
predicted by the CCC GCM. Red indicates that the geographic area in the clustered environmental
combination decreases in the future, green indicates that the clustered environment increases with
time. Yellow areas do not change in area, though they may shift geographic locations. Almost every
present environmental combination gives way to something new, resulting in a complete changeover by
2099.
|
Figure 6 shows results when we take this trend of geographic change in
area to the extremes. The top map shows two clusters presently in the
Texas panhandle which represent environmental combinations which will go
extinct according to the CCC model. These combinations of the 25
environmental variables cease to exist entirely by the year 2099
according to this forecast. The bottom map shows clusters that are
entirely new combinations in the year 2099. Environments within these
areas represent new mixes of the 25 variables, and are environments which do not exist
today. Clusters in the top map give geographic clues about locations for possible
species extinctions, while clusters in the bottom map represent locations for
possible new speciations. We have also used the MSTC technique to compare present environments with
those estimated for the period of the Last Glacial Maximum, 20-18 thousand years ago.
|
Figure 6. Environmental extinctions and new combinations predicted by the CCC GCM. Clusters in the
top map represent combinations of the 25 environmental variables which have no analog by the year
2099. These environments become extinct in the future. Clusters in the bottom map have no analog in
the present. These areas represent new environments, with different mixtures of the 25 environmental
conditions which do not currently exist.
|
Environmental niche modeling with MSTC
A simple variant of the MSTC technique permits the creation of a model of the Hutchinsonian niche or
environmental envelope within which a species can grow and reproduce (Figure 7). The process begins with a
current geographic distribution for a particular species (in this case, Pinus taeda L., loblolly
pine). Rather than specifying the number of clusters to be found, we instead specify a
within-cluster variance. Geometrically, this is equivalent to specifying a fixed radius for all clusters;
clusters with a large radius have greater within-group variance.
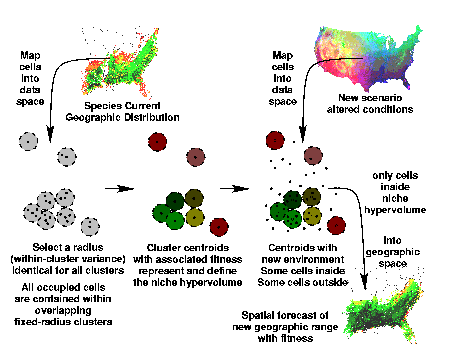
|
Figure 7. Niche hypervolume modeling using MSTC. Environmental combinations from all map cells
within the known geographic range of a species are plotted in environmental data space, and
fixed-radius, variance-based clustering is used to identify as many fixed-radius clusters as
necessary to ensure that each occupied map cell is contained within at least one of the clusters.
Mean fitness or performance measures within each cluster are associated with the cluster centroid.
All clusters, taken together like volumetric pixels, serve to locate and define the environmental
envelope for the species. A prediction can be made for a new environmental scenario by plotting the
new cells in data space, and then constructing a map only from those cells which are internal to one
of the clusters. Fitness predictions are made by assigning the productivity from that centroid to
all member map cells.
|
To develop a niche model for a particular species, as many
fixed-radius clusters are specified as
necessary to ensure that each map cell within the geographic range of
the species is contained within
at least one cluster. When all resultant clusters are taken together,
they serve as volumetric
pixels which locate and define the shape of the permissible niche for
this species within
environmental space. Selecton of the fixed radius defines the
resolution; using a smaller radius will result in the specification of
more clusters, and
will describe the niche envelope in greater detail.
Surrogate measures of performance of the species measured at each location are associated with each
environmental cluster combination comprising the niche model. The mean performance among all map
cells assigned to a cluster is assigned to that cluster, and any new map cell falling within that
cluster is assigned that productivity.
In this way, geographic predictions can be made which are not just binary presence/absence, but
include a projected estimate of how well the species will perform at each location. Multiple
performance metrics can be associated with a single niche definition; here we use production of woody
tissue in terms of m3/ha/yr.
To predict changes in a geographic distribution under a scenario of environmental change, each map
cell in the new scenario is plotted in data space. Only map cells which fall within existing
clusters are retained as permitting growth, and projected performance under that combination is
assigned.
Results
Each niche was defined in terms
of 25 environmental condition gradients, including detailed climatic,
physiographic, and soil factors. We selected a within-cluster variance
radius of 0.75, which resulted in a niche definition for loblolly
comprised of 49,324 clusters, and a niche definition for sugar maple
comprised of 45,490 clusters.
Testing the adequacy of niche models
Making a special prediction of the current geographic range of a species allows us to test the
robustness and adequacy of the niche model. Conditions present within the current U.S. are used to
predict a current geographic range for the species, which can be compared with the known actual
geographic distribution. If the predicted range is too extensive, an environmental
characteristic which is geographically limiting may have been left out. If not extensive enough, an
environmental factor that is not actually limiting to the species may have been included.
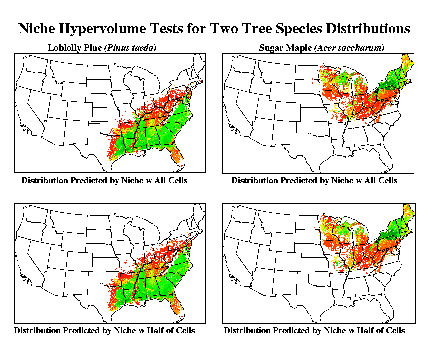
When the current conditions within the United States are compared with the hypervolume definition
predictions, the predicted distributions strongly resemble the known current distributions for both
of these tree species (Figure 8). It is as important for this verification that areas outside the
current geographic distributions of these species are NOT predicted by the niche hypervolume model as
it is that cells within the distribution ARE predicted. The geographic predictions from the
hypervolumes are slightly more extensive in terms of the marginal areas (redder), but the more
optimum core areas (yellower and greener) strongly resemble the original geographic ranges that were
used as input to the prediction process.
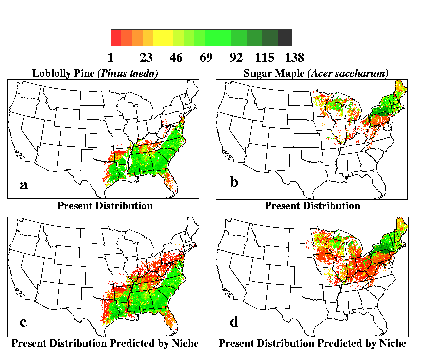
|
Figure 8. Present and predicted present geographic range productivity for Pinus taeda L. and Acer
saccharum Marsh. Niche hypervolume models were defined by analyzing 25 environmental axis
combinations from 1 km2 cells within the current geographic distributions (A, B, top row). Niche
models were then used to predict current distributions within the continental U.S. (C, D, bottom
row) as a test. Colors indicate woody production (m3/ha/yr). The ranges predicted under current
conditions strongly resemble the known ranges for both species; more area is indicated in suboptimal
parts of the range. No optimal unoccupied-but-suitable areas are indicated for either species.
|
Sensitivity of MSTC to sample size
How sensitive is the niche model to sample size? What if we randomly delete half of the cells where
the species occurs? What effect will that have on the model, and on the map that is predicted by the
model? At least as many cells will be identified as habitable in a predicted range map as are included in
the current location ``training'' set.
A substantially similar current geographic distribution is also forecast for these two species using
niche models developed when half of the occurrence locations are deleted (Figure 9). The niche
hypervolume technique could potentially be used even for species with limited geographic ranges (or
limited occurrence data), i.e., rare or endangered species.
|
Figure 9. Present and predicted present geographic range productivity
for Pinus taeda L. and Acer saccharum Marsh when half of the cells from
the original tree ranges are randomly discarded. There is very little
difference in the geographic ranges predicted from a niche model
constructed from only half of the data. The technique could
potentially be used successfully for species with limited ranges, e.g.,
threatened or endangered species. |
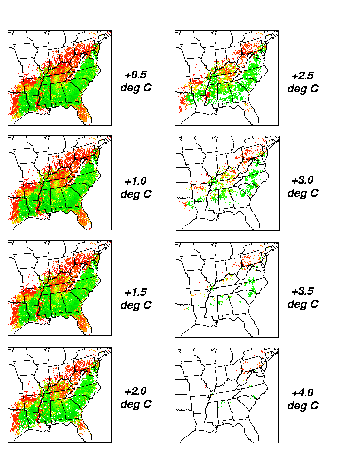
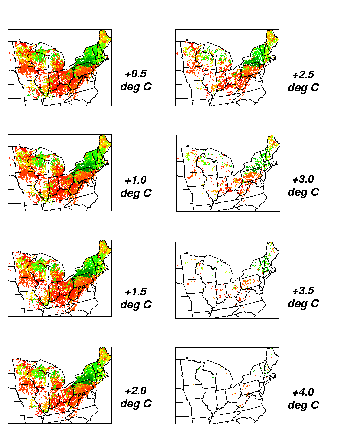
Figures 10 and 11 show sequential geographic range predictions for loblolly and sugar maple,
respectively, under a simple climate warming scenario in which mean, minimum and maximum annual temperature
are increased in a geographically uniform manner.
It was surprising to see a generalized evaporation of the geographic
range of these two species rather than a northward migration with
increased warming. Highly productive green areas do not transition
with warming to yellow, and then red, but instead
simply dissappear. We were particularly surprised to see instances
where dark green, highly productive geographic areas were present
within a ``sea'' of locations classified as unsuitable (e.g., loblolly, +3.5
degrees). One would expect a gradually decreasing fitness or
productivity, as combinations slowly reduced in suitability, rather
than an abrupt changeover from highly suitable to unsuitable.
|
Figure 10. Niche model geographic range prediction sequence for loblolly pine under a climate scenario
of geographically uniform increase in mean, maximum, and minimum annual temperature, by half degree increments.
|
|
Figure 11. Niche model geographic range prediction sequence for
sugar maple under a climate scenario of geographically uniform increase
in mean, maximum, and minimum annual temperature, by half degree
increments.
|
Discussion
We suspect that the combinatorics of 25 axes are becoming important here.
With 25 axes, there are a lot of ways to be different, and it is easy
to leave the inference space of the training data set. The niche
modeling technique could be thought of as creating a file drawer filled
with a file folder for each combination of the 25 variables under which
loblolly is known to grow. Inside each folder, the observed (and
expected) productivity of this species under this environmental
combination is filed. Some of the folders in the drawer will contain
productivities of zero, i.e., loblolly has not been observed to grow
under this combination. If the combination of 25 variables from a new
cell is not matched by a file folder in the drawer (within the radius
tolerance), the prediction will be made that loblolly will not grow at
this new location. If we think of the 25 descriptor variables in each
cell as the combination to a lock, there are many ways to get the
combination wrong, and the lock is difficult to open. It would be
easier to pick a lock whose combination had fewer numbers.
We need to further distinguish in the predictive maps the cases where we
find a file folder, but it contains a zero productivity, from cases
where there is no file folder for this new combination in the drawer.
In the former case, this is an environmental combination that we have
seen before, and we can safely predict that loblolly will not grow
under this set of conditions. In the latter case, we have encountered
a new combination, and we simply have no observational basis for making
a prediction. We need to indicate and distinguish such new
combinations geographically as regions within which we cannot predict,
perhaps by shading them in gray to distinguish them from areas where we
predict no loblolly.
The Venn diagram in Figure 12 illustrates the relationship among the sets. The
large circle on the left indicates the set of all environmental
combinations present within the current U.S. The small shaded circle
within it represents the subset of combinations within the present U.S.
within which loblolly is known to grow. Areas outside the species
niche circle but within the larger U.S. set are not currently suitable
locations/combinations for this species, i.e., are outside its current
geographic range or environmental envelope.

|
Figure 12. Venn diagram showing the set relationships between the inference space of the training set
(Current U.S), a new climate scenario, and the current environmental niche envelope for a particular
species. There is a need to geographically identify not only the shaded area within the overlap, but
also to distinguish the locations where the species won't grow from the areas where prediction is not
possible due to combinations which have never been encountered before.
|
Now the current U.S. undergoes an environmental shift, as indicated by
the arrow at the bottom, to some future scenario. Whatever portion of
the small shaded circle now falls within the overlap represents the
subset of combinations where loblolly can grow under the new scenario.
This is the portion of the set that we have previously mapped. The
species goes extinct within the remainder of its shaded niche circle,
since these combinations no longer occur. The remainder of the
overlapped area represents environmental combinations which HAVE been
seen before within the current U.S., and within which loblolly is known
NOT to occur.
Only areas within the overlap are predictable using the niche modeling
technique. As the environmental shift is more extreme, and the right
circle moves further and further from the current conditions, the area
of overlap decreases. If the environmental shift is so far and
complete that the new set of environmental conditions shares no members
with the current set and there is no overlap, then no prediction is
possible. Under such a scenario, the entire new U.S. is comprised of
unpredictable new combinations. All areas within the right circle
outside the overlap area represent new environmental combinations not
present within the current U.S. training set. Because the niche
hypervolume predictions are based on empirical observations, no
predictions are possible within this subset. These are the areas we
wish to ``gray out'' as unpredictable in the maps.
Future directions for research
Our expectation is that there will be more gray areas in the maps as
the warming sequence in Figs. 10 and 11 become more extreme, since more of the new map
cells will leave the part of the diagram representing combinations of
the 25 occurring in the present U.S. We also predict that, as the
length of the prediction interval increases and present and future
conditions continue to diverge, more combinations will become
unpredictable. Similarly, as one increases the dimensionality of a
niche model, one increases the accuracy and specificity of predictions
for combinations not too different from present ones, but limits areas
where prediction is possible as the degree of environmental change
becomes more pronounced. It may be that areas where species would be
expected to migrate will be increasingly obscured by unpredictable gray
zones, or that gray areas will form an unpredictable matrix around the
islands of high productivity which we now see.
How can we identify such formerly unencountered unpredictable areas?
We intend to construct a single ``super niche'' model which describes
and contains all of the environmental combinations everywhere within
the current U.S. This reference niche model will serve to describe the
leftmost circle in the Venn diagram, and will represent the known
inference domain for niche-based predictions. Environmental conditions
outside this ``super niche'' represent new combinations for which no
species predictions can be made. A single-pass clustering on this
niche model will provide the gray-shaded areas on the maps within which
no prediction is possible. This approach is generic, and does not
depend on the particular species niche of interest. The same ``super niche'' can be used to
identify unpredictable areas when predicting any species within the
U.S.
Acknowledgements
This research was sponsored by the Oak Ridge National Laboratory (ORNL) Seed Program. ORNL is managed by UT-Battelle, LLC, for
the U.S. Department of Energy under contract DE-AC05-00OR22725. Valuable comments were provided by
Andrew Schiller and Yetta Jager.
List of references
Hargrove, W. W., and F. M. Hoffman. 1999. "Using Multivariate Clustering to
Characterize Ecoregion Borders." Computing in Science &
Engineering 1(4):18-25.
Hartigan, J. A., and M. A. Wong. 1979. A K-means clustering algorithm.
Applied Statistics 28:100-108.
Hoffman, F. M., and W. W. Hargrove. 1998. "Making
Soup from Stones." Troubleshooting
Professional, Vol. 2, Issue 5.
Hoffman, F. M., and W. W. Hargrove. 1999a. "Parallel
Computing With Linux." Crossroads,
Volume 6, Number 1.
Hoffman, F. M., and W. W. Hargrove. 1999b. "Multivariate Geographic Clustering Using a
Beowulf-style Parallel Computer." In Proceedings of the
International Conference on Parallel and Distributed Processsing
Techniques and Applications (PDPTA '99), Volume III, H. R. Arabnia,
Ed. ISBN 1-892512-11-4, CSREA Press, pp. 1292-1298.
Hoffman, F. M., and W. W. Hargrove. 1999c. "Cluster Computing: Linux Taken to
the Extreme." Linux
Magazine, Vol. 1, No. 1, pp. 56-59.
Kittel, T.G.F., N.A. Rosenbloom, T.H. Painter, D.S. Schimel, H.H. Fisher,
A. Grimsdell, VEMAP Participants, C. Daly, and E.R. Hunt, Jr. November 1996 (revised
August 1999). The VEMAP Phase I Database: An integrated input dataset for ecosystem and vegetation modeling
for the conterminous United States. http://www.cgd.ucar.edu/vemap/users_guide.html.
Mahinthakumar, G., F. M. Hoffman, W. W. Hargrove,
and N. T. Karonis. November 13-15, 1999. Multivariate
Geographic Clustering in a Metacomputing Environment
Using Globus. Proceedings of the ACM/IEEE SC99 Conference, Portland, OR.
Authors
William W. Hargrove,Landscape Ecologist
Computational Physics and Engineering Division
Oak Ridge National Laboratory, Oak Ridge, TN 37831-6274
Email: hnw@fire.esd.ornl.gov
Tel. 865/241-2748, FAX 865/241-3870
Webpage: http://research.esd.ornl.gov/~hnw/
Forrest M. Hoffman, Research Scientist
Environmental Sciences Division
Oak Ridge National Laboratory, Oak Ridge, TN 37831-6036
Email: forrest@esd.ornl.gov
Tel. 865/576-7680, FAX 865/576-8543
Webpage: http://research.esd.ornl.gov/~forrest/


